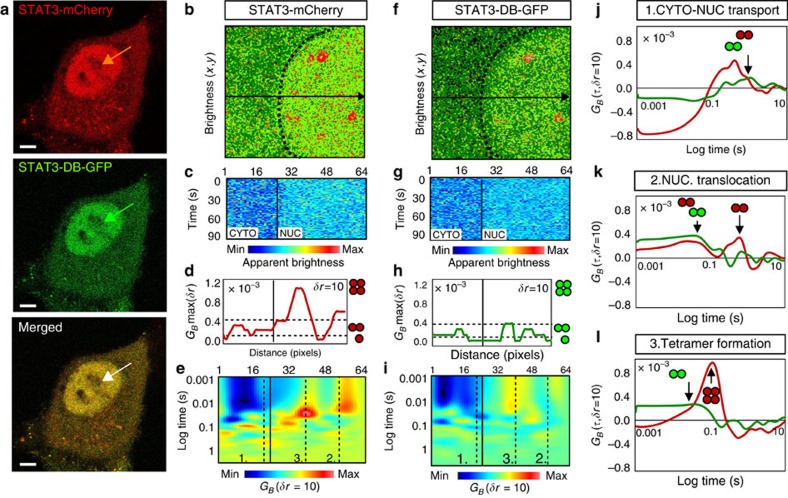
Figure 5. pCOMB analysis of STAT3 DNA binding as a function of oligomeric state.
(a) HeLa cell transfected with STAT3-mCherry and STAT3-DB-GFP after 15-min stimulation with 10 nM oncostatin M. Region of interest for brightness and pCOMB analysis is indicated by the arrow. Scale bar, 5 μm. (b) Brightness analysis of STAT3-mCherry: dark green pixels represent monomers, light green pixels dimers and red pixels tetramer (mCherry monomer calibration presented in Supplementary Fig. 3a–d). (c–e) pCOMB analysis: brightness carpet (c); pair correlation maximum amplitude GBmax (d); and pCOMB carpet (e) for STAT3-mCherry. GBmax was calibrated with respect to monomeric mCherry in Supplementary Fig. 3e–f. (f) Brightness analysis of STAT3-DB-GFP (brightness distribution and monomer calibration are presented in Supplementary Fig. 6a–d). (g–i) pCOMB analysis: brightness carpet (g); pair correlation maximum amplitude GBmax (h); and pCOMB carpet (i) for STAT3-DB-GFP. GBmax was calibrated to monomeric GFP in Supplementary Fig. 6e–f. In e and i, pCOMB carpet was pseudocoloured from monomer (blue) to highest-order oligomer (red). (j–l) pCOMB profiles for STAT3-mCherry (red) and STAT3-DB-GFP (green) translocation across the nuclear envelope (j, position 1 in e,i), intra-nuclear dimer translocation (k, position 2 in e,i) and intra-nuclear tetramer formation (l, position 3 in e,i). CTYO, cytoplasm; Max, maximum; Min, minimum; NUC, nucleus.

