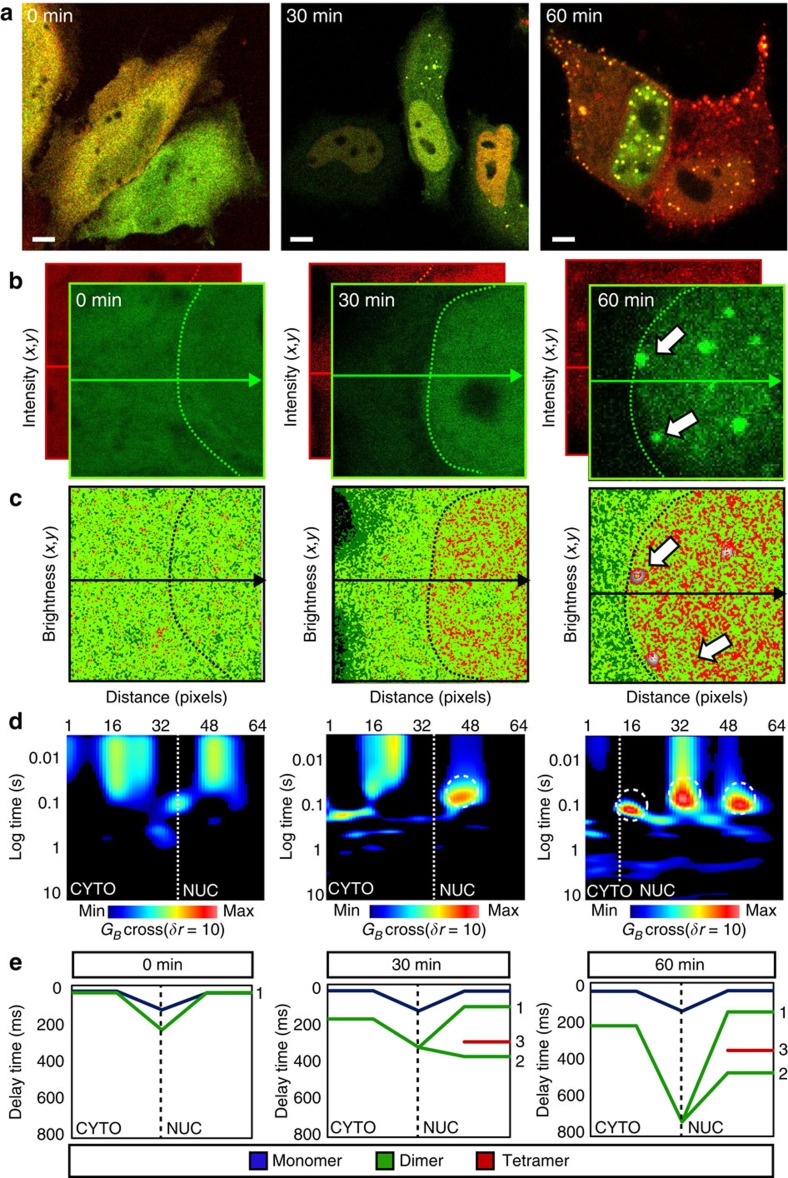
Figure 8. Prolonged cytokine stimulation enhanced STAT3 dimer-to-tetramer transition (cpCOMB analysis).
(a) HeLa cells transfected with STAT3-GFP and STAT3-mCherry after 0, 30 and 60 min stimulation with 10 nM oncostatin M. Scale bar, 5 μm. (b) Intensity images of STAT3-GFP and STAT3-mCherry at 0, 30 and 60 min for a region that spans cytoplasm and nucleus. The nuclear boundary is indicated by the green dotted line. (c) Pseudocoloured brightness maps for STAT3-GFP at 0, 30 and 60 min. Dark green pixels represent monomers, light green pixels dimers and red pixels tetramer. At the 60 min time point, the white arrows point to STAT3 puncta that were immobile and so no brightness values were obtained. (d) cpCOMB carpets at 0, 30 and 60 min. White dashed circles highlight tetramer formation. (e) Transit time for STAT3 to traverse the cytoplasm, nuclear envelope and nucleus as a monomer (blue line), dimer (green line) and tetramer (red line) before and after (30–60 min) oncostatin M stimulation (n=6 cells at each time point). After stimulation, a subset of STAT3 dimers diffused freely (1), became immobilized (2) and form immobilized tetramers (3).

