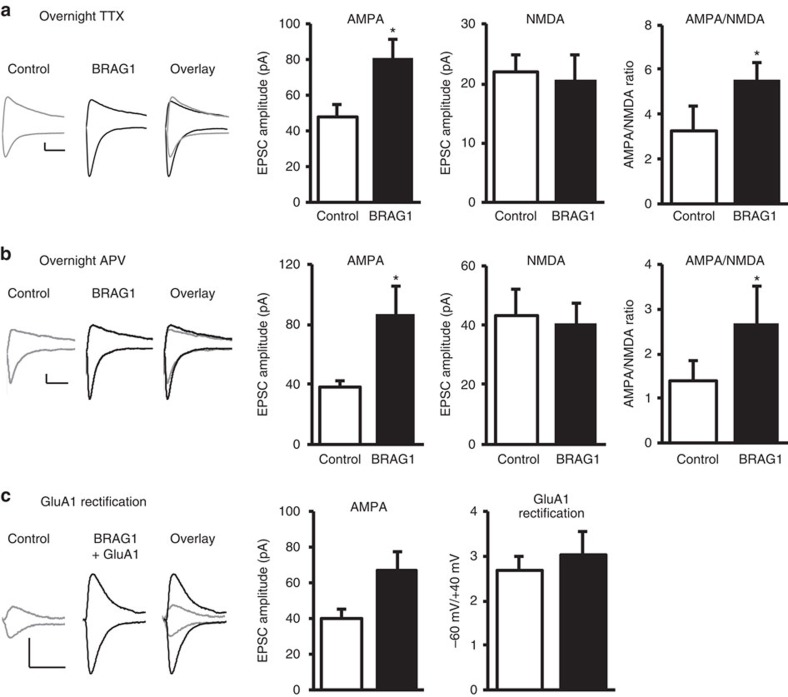
Figure 4. BRAG1 enhances synaptic strength independently of synaptic activity or GluA1 insertion.
(a,b) Insets: sample traces of AMPAR- and NMDAR-mediated synaptic responses recorded at −60 (left) and +40 mV (right), respectively. Scale bars, 20 pA, 20 ms. Data represent averaged evoked EPSCs recorded for AMPA (left graphs), NMDA (middle graphs) and AMPA/NMDA ratios (right graphs) simultaneously from pairs of nearby untransfected and BRAG1-transfected CA1 neurons treated overnight with TTX (a; AMPA: n=8, P=0.013; NMDA: n=8, P=0.51; AMPA/NMDA: n=7, P=0.020) or APV (b; AMPA: n=9, P=0.023; NMDA: n=6, P=0.64; AMPA/NMDA: n=6, P=0.031). (c) Insets: sample traces of evoked AMPAR-mediated synaptic responses recorded at −60 and +40 mV from control cells or cells co-transfected with BRAG1 and GluA1. Scale bars, 20 pA, 20 ms. Left graph shows AMPAR-mediated responses recorded at −60 mV (n=14, P=0.027). Right graph shows the rectification index, which was calculated as the ratio of the amplitude of AMPAR-mediated responses at −60 mV to that at +40 mV (n=13, P=0.39). * Indicates significance (P≤0.05).

