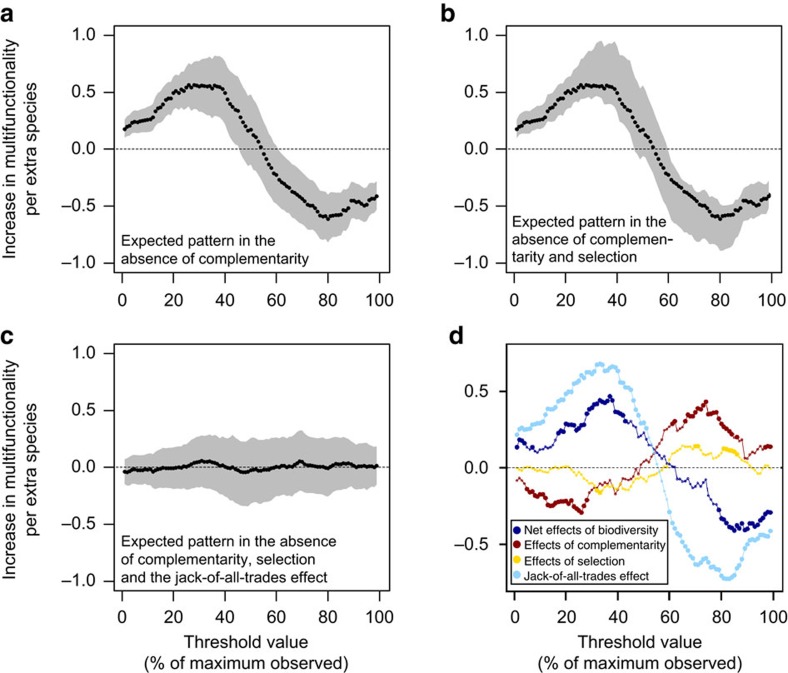
Figure 3. The biodiversity effect on multifunctionality partitioned into different mechanisms.
Based on linear mixed models (N=209 plots). The expected biodiversity effect is shown for a scenario where (a) complementarity (MFexp1), (b) both complementarity and selection (MFexp2) and (c) complementarity, selection and the jack-of-all-trades effects (MFexp3) are excluded, for a range of multifunctionality threshold values. (d) The net biodiversity effect on multifunctionality (blue line), partitioned into complementarity (red), selection (yellow) and the jack-of-all-trades (green) effects. The dotted, horizontal lines show a biodiversity effect of zero. The grey polygon represents the 95% confidence area in a–c, while points significantly deviating from zero are extra-large in d.

