Fig. 5.

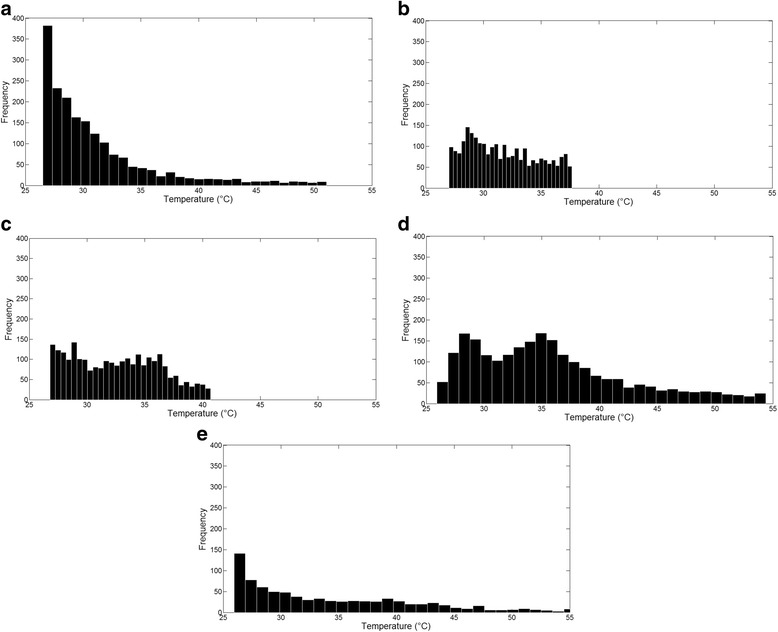
Histograms with temperatures values inside the chosen ROI from the images in Fig. 5. a Block bone phantom. b Cylinder bone phantom. c F1 sample. d T1 sample. e Fc2 sample

Histograms with temperatures values inside the chosen ROI from the images in Fig. 5. a Block bone phantom. b Cylinder bone phantom. c F1 sample. d T1 sample. e Fc2 sample