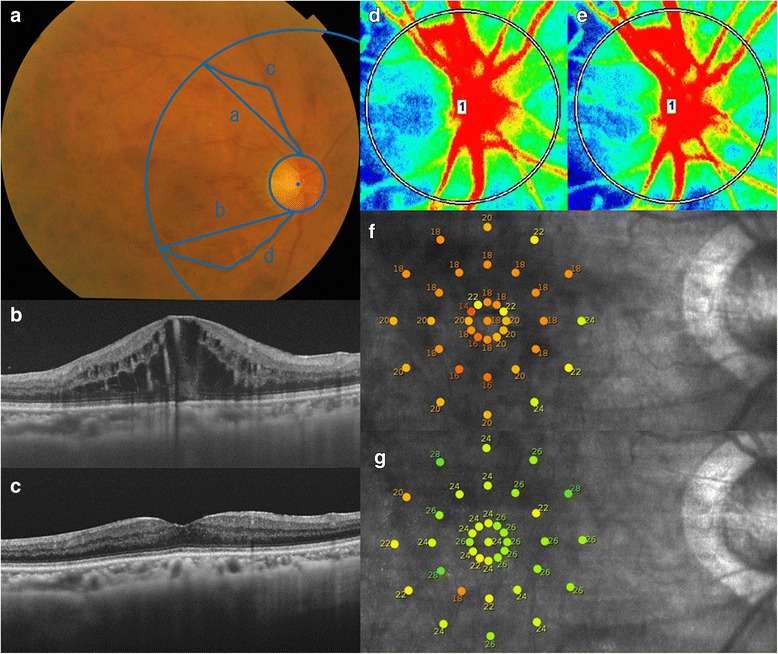
Fig. 1.

Ophthalmologic examination images before and 6 months after anti-VEGF therapy for central retinal vein occlusion. Fundus photograph, spectral-domain optical coherence tomographic (SD-OCT) images, laser speckle flowgraphic (LSFG) images, and microperimetric maps before and 6 months after an initial anti-VEGF therapy of the right eye of a 66-year-old woman with cystoid macular edema (CME) due to a central retinal vein occlusion are presented. The decimal best-corrected visual acuity was 0.5 before the treatment and 1.0 at 6 months after the treatment. a: Fundus photograph at the baseline. The venous tortuosity index was calculated on color fundus photograph. Measurements of superior and inferior venous arcades were obtained starting from the optic disc margin to the crossing point of a circle whose diameter is the distance from the center of optic disc to the fovea. The course of the veins was traced using Photoshop (Adobe Systems, Inc. Ca, USA). NIH ImageJ software was used to measure the lengths of the tortuous vein (c and d) and chord of the vessels (a and b). The venous tortuosity was calculated by dividing the length of the tortuous retinal vein by the chord length of the same segment (c/a and d/b). The average of the venous tortuosity ((c/a + d/b)/2) was calculated to obtain the venous tortuosity index. b: SD-OCT image at the baseline showing CME. c: SD-OCT image at 6 months showing a resolution of the CME. d: A false-color composite map of the optic nerve head was created using the LSFG findings at the baseline. The red area indicates a faster blood flow, and the blue area indicates a slower blood flow. e: A false-color composite map by LSFG at 6 months. There is no obvious difference in the blood flow as compared with the LSFG map at the baseline (d). f: Microperimetric map image at the baseline. A total of 37 stimulus locations covering the central 10° field were tested. The mean retinal sensitivity at the 37 locations is 19.1 dB. g: Microperimetric map image at 6 months. The mean retinal sensitivity at the 37 locations is 24.5 dB
