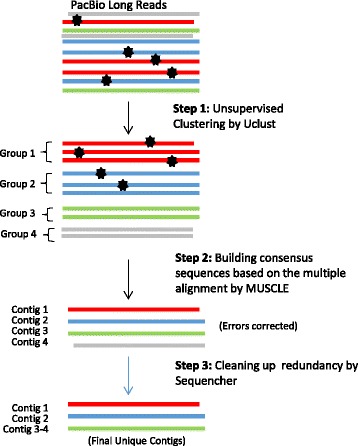
Fig 2.

Schema of the clustering-based data analysis procedure using PacBio long reads. The different colors represent the reads belonging to different isoforms. The black stars represent sequencing errors. In this example, contig 3 and 4 are merged because they are the plus and minus strands of the same isoform
