
Fig. 2.
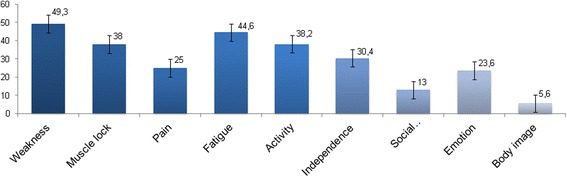
INQoL Domain Scores representing the impact of each impaired domain on patients quality of life; the bars show standard errors. Higher scores indicate the higher impact of disease (N = 64)
Official websites use .gov
A
.gov website belongs to an official
government organization in the United States.
Secure .gov websites use HTTPS
A lock (
) or https:// means you've safely
connected to the .gov website. Share sensitive
information only on official, secure websites.
INQoL Domain Scores representing the impact of each impaired domain on patients quality of life; the bars show standard errors. Higher scores indicate the higher impact of disease (N = 64)