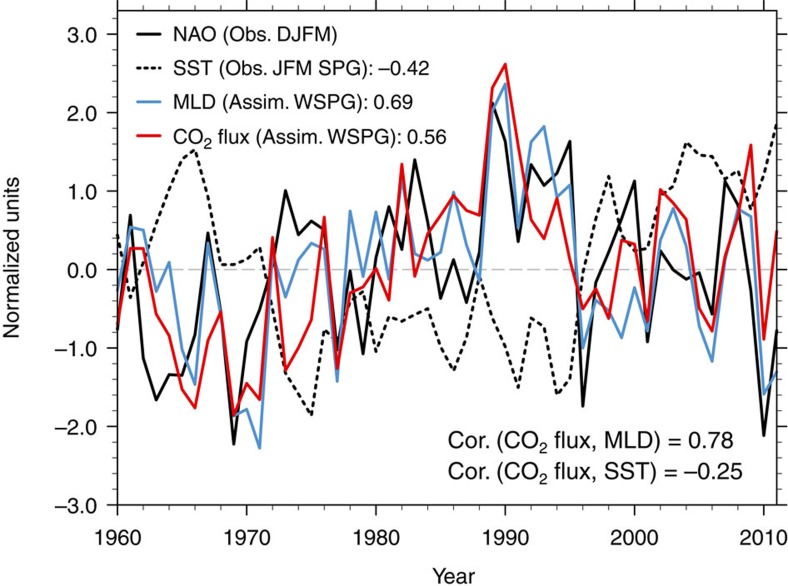
Figure 2. Normalized time series of CO2 flux and related physical variables.
The observed (Obs.) DJFM NAO21, observed JFM SST22 in SPG region, western SPG (WSPG) MLD and CO2 flux calculated with the assimilation run are shown with black solid line, black dashed line, blue solid line and red solid line, respectively. The location of SPG and WSPG refers to green box in Fig. 1a,b, respectively. The correlation (Cor.) coefficients between time series and NAO (CO2 flux) are shown on the top (bottom) of the figure. The normalized time series are calculated by dividing individual variable anomalies with their respective standard deviation.

