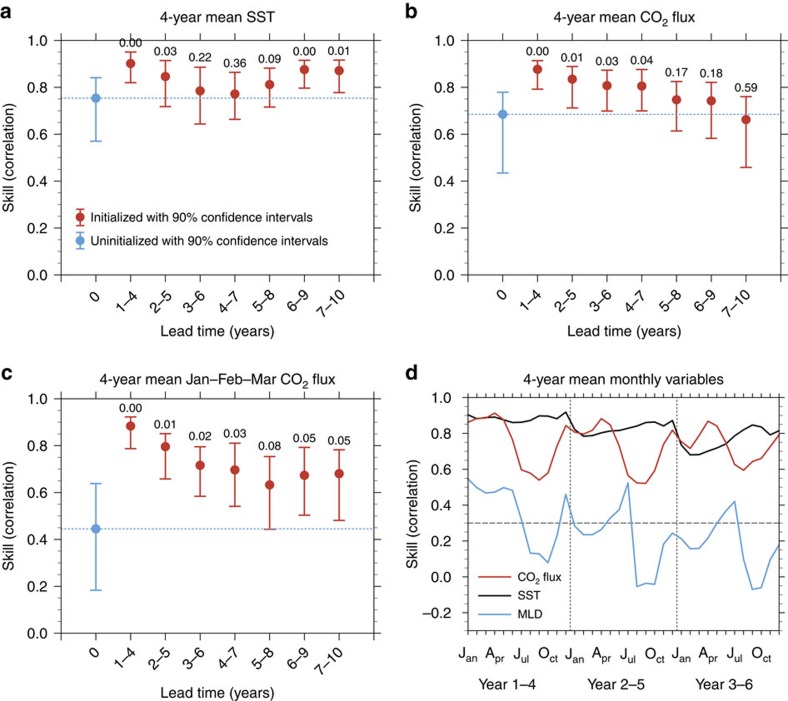
Figure 3. Potential predictive skill of CO2 flux and related physical variables.
Correlation skill of ensemble mean of 4-year mean SST (a), 4-year mean CO2 flux into the ocean (b), seasonally stratified 4-year mean CO2 flux into the ocean (late winter, that is, January–February–March) (c) and monthly stratified 4-year mean CO2 flux, SST and MLD (d) in the western SPG region. Shown are uninitialized (blue dot in a–c) and initialized (red dots in a–c) simulations at different lead time verified against assimilation. The correlations are calculated from 4-year mean predictions (that is, years 1–4, 2–5 and so on) of initialized simulations, and 4-year running mean of the corresponding assimilation and uninitialized time series. To ensure that the number of validation years is the same for both initialized and uninitialized simulations, we use the common time period from 1967–1970 mean to 2008–2011 mean. The blue dashed line in a–c extends the uninitialized correlation for easy comparison. The vertical lines in a–c provide 90% confidence intervals based on a bootstrap approach46. The numbers on the top of the bars in a–c show the P values based on the hypothesis that the difference of correlations between the initialized and uninitialized simulations is smaller or equal to zero based on 1,000 bootstrapped resamples. The potential predictive skills of monthly stratified 4-year mean CO2 flux, SST and MLD in d are shown with red, black and blue curves, respectively. Three-month running mean is applied before monthly correlation estimation in d. The horizontal dashed grey line in d shows the 95% level of significance based on a two-sided t-test. The vertical dashed grey lines in d are added to better distinguish different lead year results.

