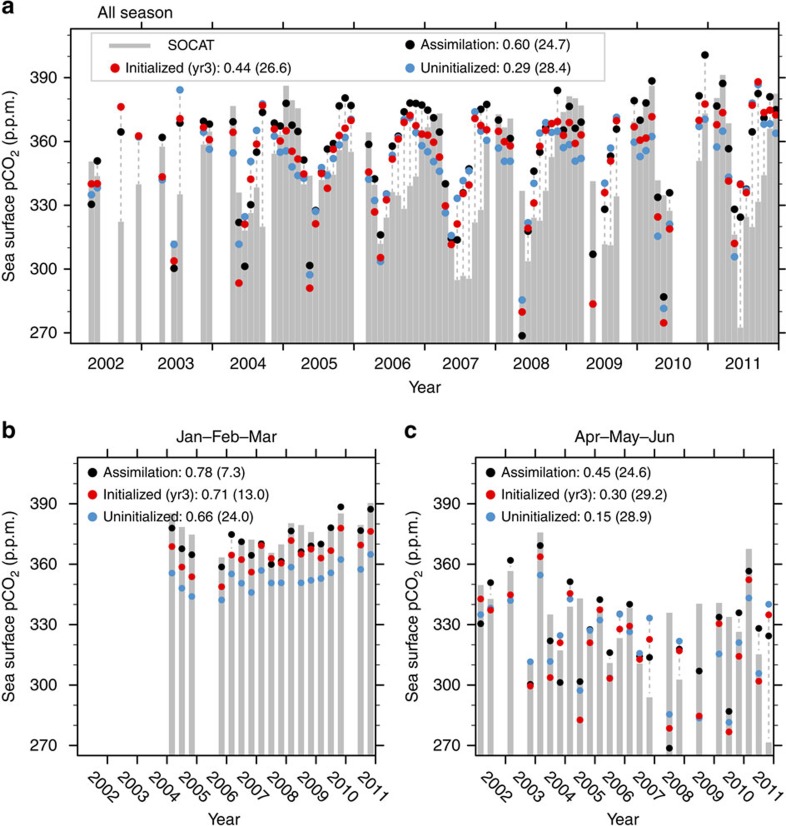
Figure 4. Observed and model simulated monthly mean ocean surface pCO2 in western SPG region.
(a) All season time series, (b) only January–February–March are shown and (c) only April–May–June are shown. The SOCAT observations36 are shown with grey bars, and model output of assimilation, uninitialized simulations and initialized simulations at a lead time of 3 years (yr3) are shown in black, blue and red dots, respectively. The grey dashed lines connect outlier dots with the grey bars to make the comparison clearer. The numbers in legend are correlation coefficients and root mean squared error (in brackets) between model simulations and SOCAT observations. For the all season time series in a the correlations of the assimilation and initialized simulations at lead time of 3 years are significantly larger than that of the uninitialized simulations at 95% significant level based on a bootstrap test. Note the SOCAT observational data are not continuously distributed in space and time; the model simulations are averaged over the grid points where SOCAT data are available.

