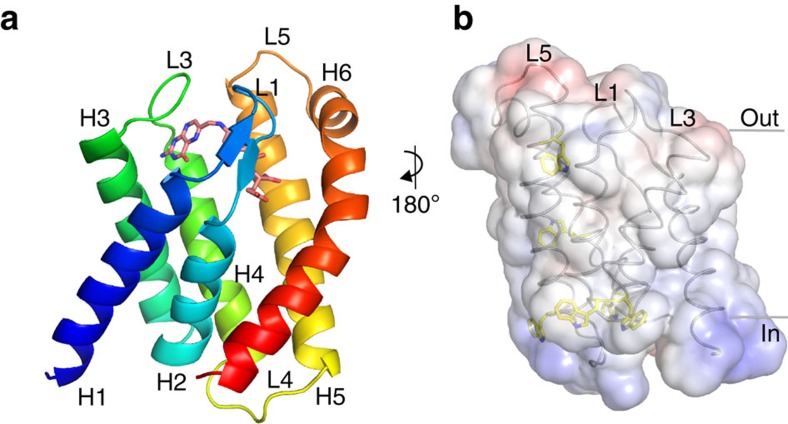
Figure 1. Crystal structure of folate-bound FolT1.
(a) Cartoon representation of FolT1 coloured from blue (N terminus) to red (C terminus), with folate shown in stick representation. H1-6 indicates α-helices 1-6. The carbon atoms of folate are shown in deep salmon, the oxygen and nitrogen atoms are shown in red and blue, respectively. The colour coding for oxygen and nitrogen atoms remained throughout the article. The membrane orientation was derived from the hydrophobicity of the surface, the positive inside rule and the location of aromatic residues shown in b, in which the transparent surface is coloured according to the surface electrostatic potential (negative potential in red and positive potential in blue), and tryptophan residues are shown in sticks with their carbon atoms coloured yellow. The bottom of the protein faces the cytoplasm, while the top faces the extracellular side of the membrane.

