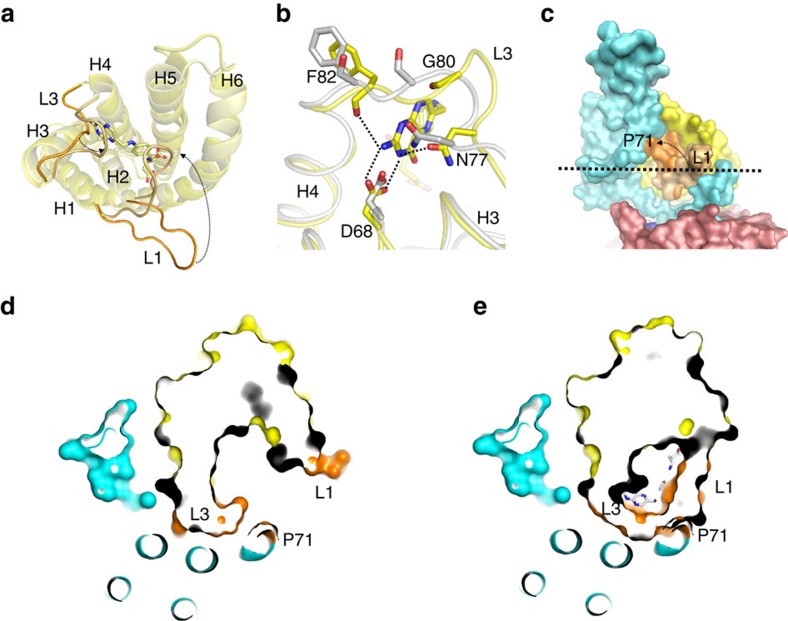
Figure 4. Comparison of folate-bound FolT1 and substrate-free FolT2.
(a) Structural alignment of folate-bound FolT1 (pale yellow) and substrate-free FolT2 (bright yellow). The viewpoint is from the extracytoplasmic side of the membrane. The carbon atoms of folate are shown in pale yellow and loops L1 and L3 are coloured in pale and bright orange for FolT1 and FolT2, respectively. (b) Repositioning of loop L3 of FolT2 (grey) compared with FolT1 (yellow) disrupts the interactions with folate, of which the carbon atoms are coloured yellow. Binding-site residues are indicated using the one-letter code for amino acids. (c) Surface representation showing how loop L1 (orange) of substrate-bound FolT1 would clash with P71 (orange) of EcfT when forming a complex with the ECF module. Loop L1 of FolT2 is shown in pale orange for comparison. The dashed arrow shows the movement of loop L1 between FolT2 and substrate-bound FolT1. (d) Slice-through representation of ECF–FolT2 at the level of the dashed line in c. FolT2 is shown in surface representation with loops L1 and L3 in orange, and P71 of EcfT in orange surface representation. (e) The same slice as shown in d but with substrate-bound FolT1 replacing FolT2, with the carbon atoms of folate shown in grey. Loops L1 and L3 would clash with P71.

