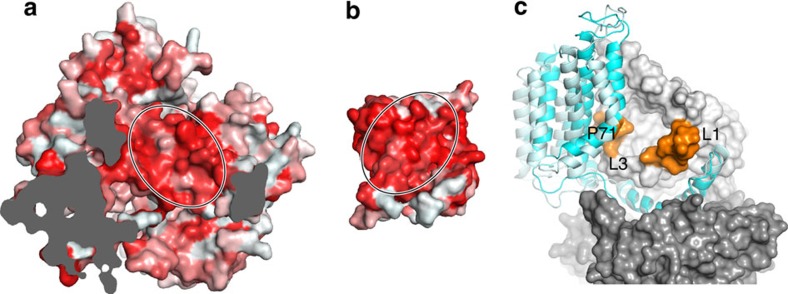
Figure 5. Sites of interaction between EcfT and FolT2.
(a) Slice-through of the ECF module in surface representation viewed from the extracellular side of the membrane. FolT2 has been deleted to show the hydrophobic platform on top of the coupling domain of EcfT, indicated by the oval. Colouring according to hydrophobicity, from red (hydrophobic) to grey (hydrophilic). (b) Surface of FolT2 interacting with the surface shown in a, using the same colour-coding. (c) Structural flexibility in the EcfT subunit. The apo and AMP–PNP-bound structures were superimposed by structural alignment of the ATPase subunits (dark grey surface representation). The resulting positions of the EcfT subunits are shown in cartoon representation with a viewpoint from the membrane plane. The coupling domains with coupling helices CH1-3 are in almost identical positions in the two complexes, but the membrane domains differ. The membrane domain in the apo-structure (grey) has hinged away compared with the AMP–PNP-bound structure (cyan). Proline 71 on TMH3 of EcfT as well as loops L1 and L3 in FolT2 are shown in orange.

