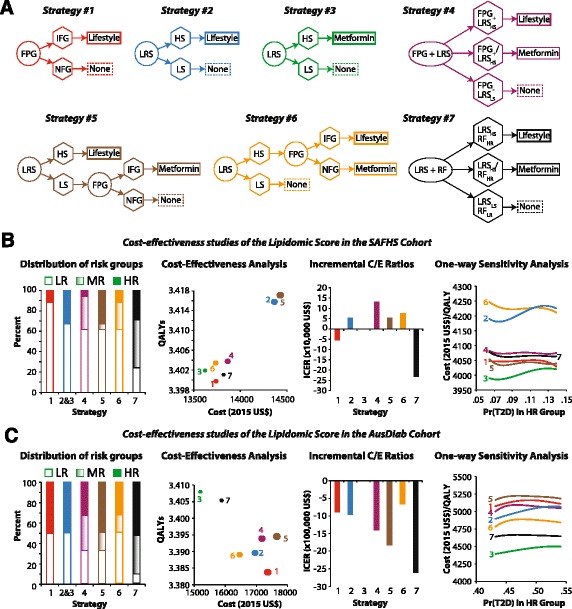
Fig. 4.

Cost effectiveness analyses of candidate screening and intervention strategies for T2D risk-stratification. a The seven strategies that were considered. The diagrams use the following convention: circles, name of the screening test; hexagons, results of the screening test; rectangles, suggested intervention; thick border for rectangles, high-risk group; thin border for rectangles, moderate-risk group; dashed border for rectangles, low-risk group. The abbreviations used in the panel are as follows: FPG, fasting plasma glucose; IFG impaired fasting glucose; NFG, normal fasting glucose; LRS, lipidomic risk score; HS, high score; LS, low score; RF, risk factor assessment. For LRS, a high score was defined on the basis of cutoffs defined by receiver-operating-characteristic curves. The strategies are color coded and the colors are consistently used in panels B and C. The full decision tree based on the seven strategies is shown in (Additional file 1: Figure S6). Details of the costs and utilities are provided in Material and Methods, (see Additional file 1: Figure S6, Tables S7 and S8). b Cost-effectiveness analyses based on the LRS in the SAFHS cohort. Leftmost plot shows the relative distribution of the risk groups based on the screening strategy used (LR, low-risk group; MR, moderate-risk group; HR, high-risk group). The plot second from left shows costs (2015 US$) and quality-adjusted life years (QALYs) for each strategy. The size of the markers is proportional to the expected risk reduction in T2D incidence. The next plot shows incremental cost-effectiveness ratios using the most cost-effective strategy (#3) as the reference strategy. The rightmost plot shows smoothed results of sensitivity analyses that used 1000 microsimulation runs. The results were smoothed using fourth-order polynomial regression lines. Sensitivity analyses shown here are for the variable (probability of T2D at 5-years in HR individuals) to which the decision was most sensitive based on the tornado diagrams shown in (Additional file 1: Figure S7). c Cost-effectiveness analyses based on the LRS in the AusDiab cohort. Key to plots is the same as those for plots in (Panel b). Full numerical results of cost effectiveness analyses for both cohorts are provided in (Additional file 1: Table S9)
