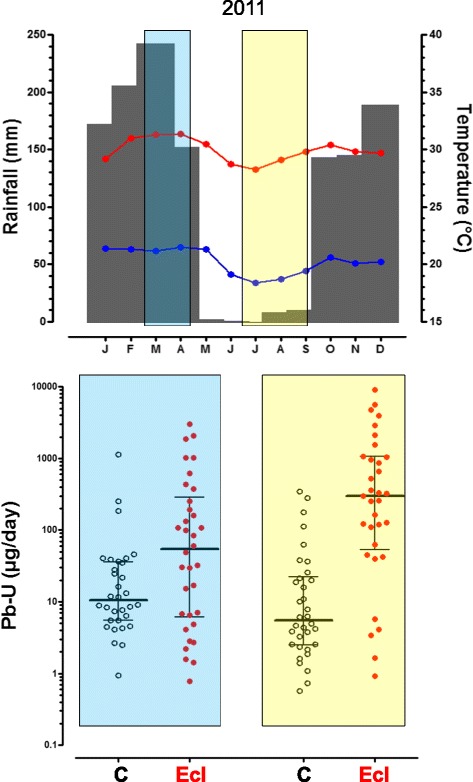
Fig. 2.

Meteorological data for 2011 in Kinshasa and daily urinary excretion of lead by pregnant women with and without preeclampsia. Upper panel: monthly rainfall (grey columns) and monthly averages of maximal (red line) and minimal (blue line) daily temperature in 2011 (Binza meteorological station). The light blue rectangle indicates the recruitment between March 1st and April 18th during the rainy season and the light yellow rectangle indicates the recruitment between July 1st and September 2nd during the dry season. Lower panel: individual values (with medians and 25th and 75th percentiles) of the daily urinary excretion of lead (Pb-U in μg/day) for pregnant women without (C, open symbols) and with preeclampsia (Ecl, full symbols), during the rainy season (light blue rectangle, left) and the dry season (light yellow rectangle, right). See Table 5 for significance levels
