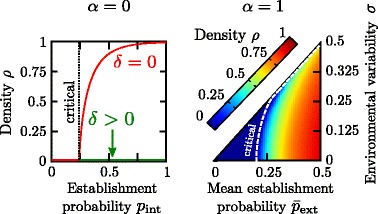
Fig. 3.

Stationary density of single phenotype syndromes. Both single-phenotype dispersal syndromes, α=0 (left) and α=1 (right), exhibit a phase transition between an absorbing phase where the population always becomes extinct, and an active phase, with a sustained non-vanishing stationary density ρ. For the non-dispersing syndrome (left) the population always becomes extinct with non-null inbreeding depression (δ>0, green curve), while there is a phase transition at p int≃0.24 if δ=0 (red curve). In the dispersing syndrome (right), the critical point increases as a function of the degree of environmental variability, σ>0, i.e. variability is detrimental to population density, expanding the absorbing phase (dark blue region) at the expense of the active one. The critical line has been computed with the analytical approach described in the Additional file 2: Appendix for an infinite system, L=∞. To compute the stationary densities, we iterated for 104 generations, and averaged over the last 104/2 steps; averages over at least 100 independent realizations were performed. Parameters are set to L=100 and n=5
