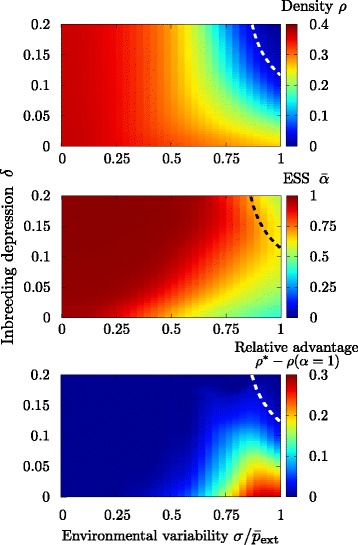
Fig. 6.

Optimal strategy. The mean dispersal propensity parameter α is self-tuned dynamically in a community of individuals through evolutionary dynamics, based on the genetic algorithm of [24, 25]. (Upper panel) Color plot of the stationary density as a function of the inbreeding depression δ and the environmental variability σ; the dashed line represents the critical line separating absorbing and active phases in the quasi-stationary ensemble (i.e., the system is not allowed to go fully extinct) and is established as the parameter combinations that ensure a stationary density =1 %. Although individual plants have the possibility of developing mixed strategies, the population always becomes extinct whenever both δ and σ are high; i.e. under very adverse conditions. (Middle panel) Average value of α across the population in its steady state. The dispersing syndrome is favored whenever the environmental variability is low σ<0.05 and/or inbreeding depression is high (red region). The ESS corresponds to mixed dispersal when environmental variability is significant (orange to green region). The parameter space in which the ESS corresponds to predominantly non-dispersing syndromes is very narrow (hardly visible dark blue region in the lower right hand corner) and requires inbreeding depression to be negligible and environmental variability to be large. (Lower panel) Relative advantage of the mixed dispersal syndromes: stationary density of the optimal mixed dispersal syndrome, ρ ∗ (obtained from the genetic algorithm), minus the density for the fixed dispersal syndrome. Parameters have been set to L=100, , n=5 and ν=10−3, and averages are performed over the last 105/2 steps in 10 independent simulations iterated for 105 generations
