Figure 5.
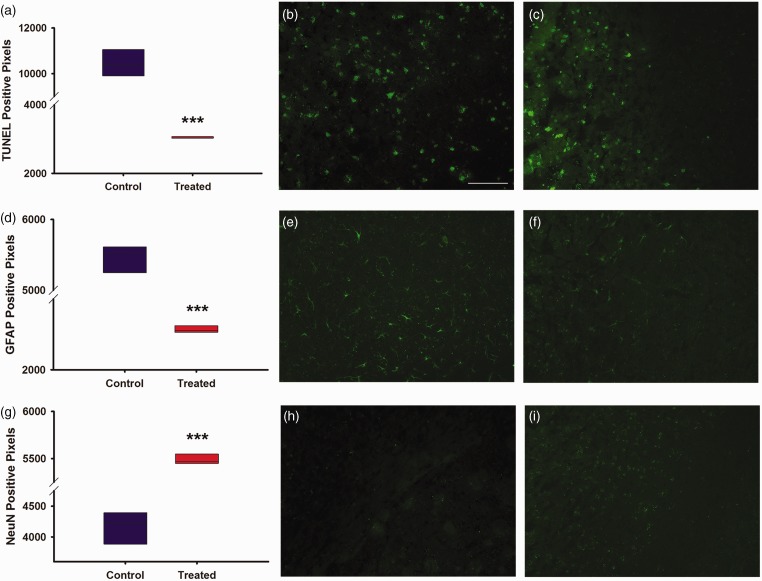
Graphs and images for immunohistochemistry, magnification at 20X with quantification of positive pixel density. (a) Graph depicting positive pixel for TUNEL stain of control versus treated in infarcted region. (b) Image of control TUNEL stain from infarcted region at magnification 20X. (c) Image of treated TUNEL stain from infarcted region at magnification 20X. (d) Graph depicting positive pixels for GFAP stain of control versus treated in infarcted region. (e) Image of control GFAP stain from infarcted region at magnification 20X. (f) Image of treated GFAP stain from infarcted region at magnification 20X. (g) Graph depicting positive pixels for NeuN stain of control versus treated in infarcted region. (h) Image of control NeuN stain from infarcted region at magnification 20X. (i) Image of control and treated NeuN stain from infarcted region at magnification 20X. Treated (N = 10), control (N = 10). White scale bar, 100 µm. *** indicates P ≤ 0.001.

