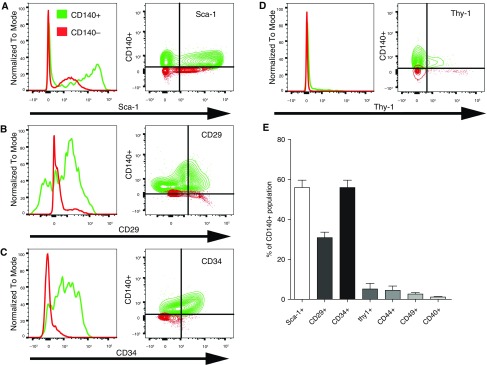
Figure 2.
Immunophenotyping of PDGFRα+ and PDGFRα⁻ fibroblasts in adult mouse lungs. Lin⁻ (CD45⁻CD326⁻CD31⁻) stromal cells were gated for CD140α+ (green) or CD140α (red) subpopulations, and expressions of (A) SCA-1, (B) CD29 (integrin β1), (C) CD34, (D) Thy1 (CD90), CD44, and CD49, and (E) CD40 were compared between the CD140α+ and CD140α⁻ fibroblasts. Histograms and bivariate contour plots of surface marker expression of PDGFR-positive and -negative cells are shown by overlay. (E) Percentage of all CD140α+ coexpressing one of the surface markers was determined by flow cytometry and was summarized in the bar graph. Data are expressed as mean ± SEM, and comparisons among groups were made by analysis of variance, with P < 0.05 considered significant (n > 3).

