Figure 3.
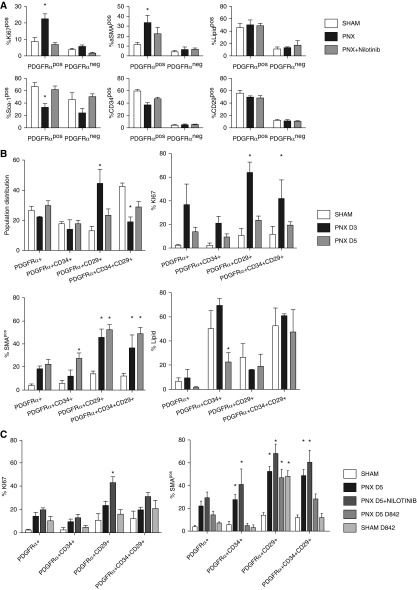
PDGFRα+ interstitial resident fibroblasts (iReFs) proliferate and induce α-SMA during alveolar regeneration. (A) PDGFRα+ and PDGFRα− fibroblasts were analyzed for proliferation (Ki67+) and for the expression levels of α-SMA, neutral lipid, sca-1, CD34, and CD29. Freshly isolated PDGFRα-positive and -negative lung fibroblasts were compared among sham (white), pneumonectomy (PNX, black), and PNX with nilotinib treatment (PNX + nilotinib: gray). (B) Freshly isolated PDGFRα+ iReFs were stained for CD29 and CD34 to separate PDGFRα+ iReFs into four subpopulations. Each population was analyzed for proliferation (Ki67+), lipid content, and α-SMA expression 3 and 5 days after PNX. Proportion, proliferation (Ki67), α-SMA expression, and neutral lipid contents were analyzed in fibroblast populations and compared between sham (white) and PNX (PNX D3: black; and PNX D5: gray). (C) Freshly isolated PDGFRα+ iReFs were stained for CD29 and CD34 to separate PDGFRα+ iReFs into four subpopulations and were analyzed for proliferation, and α-SMA expression in the presence or absence of the PDGFR kinase inhibitor nilotinib and the dominant active PDGFRα-D842V mutation were compared between sham (white), PNX after 5 days (PNX: black), PNX with nilotinib treatment (PNX + nilotinib: dark gray) and PNX in PDGFRα-D842V mutant mice (PNX+D842V: gray, SHAM+D842V: light gray). *Significant changes compared with sham. Data are expressed as mean ± SEM. Comparisons among groups were made by analysis of variance, with P < 0.05 considered significant. Each group represents three or more animals. Neg, negative; pos, positive.

