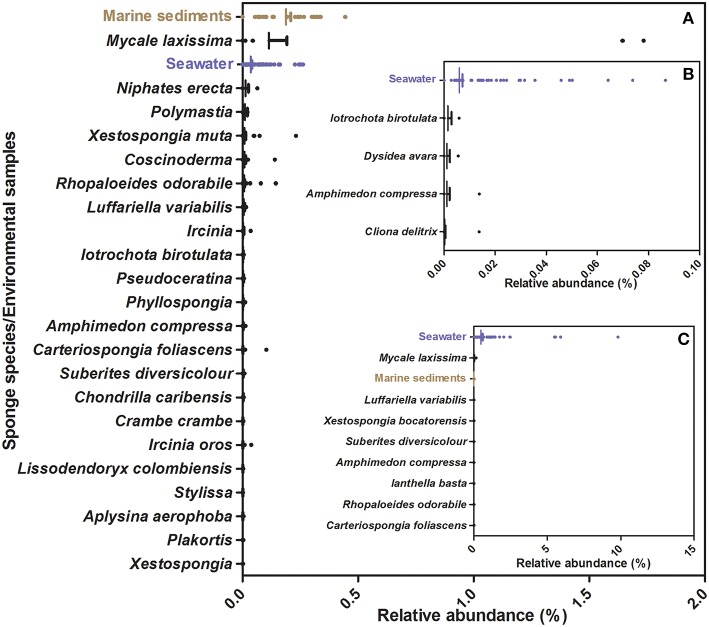
Figure 5.
Relative abundance of OTUs from the Sponge Microbiome Project with ≥98% identity to 16S rRNA sequences from strains isolated in this study. (A) Information relative to OTUs closely affiliated to isolate Cc27, (B) Information relative to OTUs closely affiliated with isolate Pv91. (C) Information relative to OTUs closely affiliated with isolates Pv86. Vertical bar represents the mean, the hinge represents SEM (Standard Error of Mean), and dots represent outlier values beyond mean.

