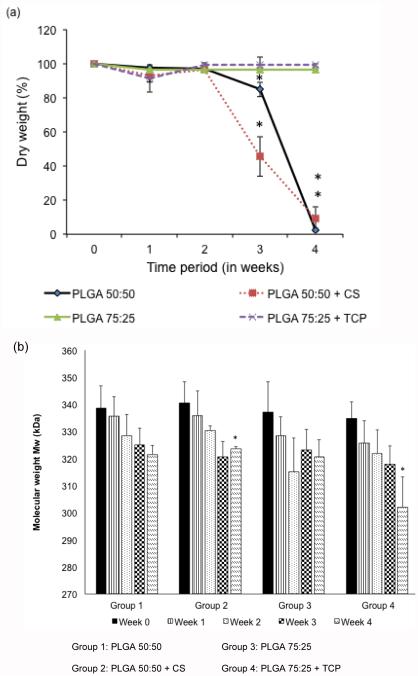
Figure 2.
Dry weight and molecular weight analysis of the scaffolds. (a) Relative dry mass (n=5), of all the groups over a 4 week period, (b) weight-average molecular weight change Mw (n=4), of polymeric scaffolds in the aqueous medium over time. Raw materials (CS & TCP) encapsulation led to faster decrease in Mw than the control groups. All groups exhibited more than 10% decrease in Mw by the end of week 4. Error bars represent mean ± SD. (*) denotes statistically significant difference (p < 0.05) in value from week 0.

