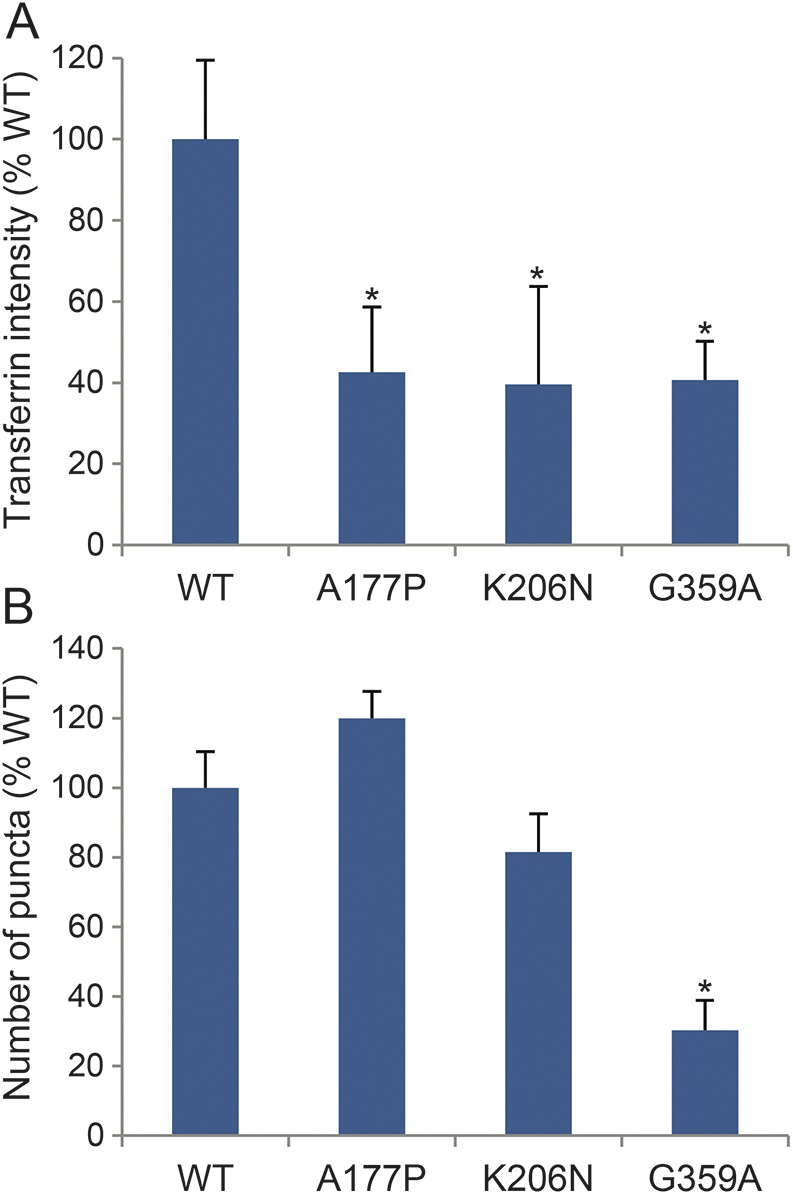
Figure 3. Quantification of transferrin uptake and cellular localization patterns.

(A) High-content imaging analysis of transferrin fluorophore intensity in positively transfected HeLa cells. All 3 mutations confer nearly a 60% reduction in transferrin uptake compared to wild type (WT). Error bars represent SD between 5 replicate wells. p < 0.05 by Student t test. (B) High-content imaging spot identification revealed a 50% reduction in the number of puncta in cells expressing the G359A mutation. Error bars represent SD among 5 replicate wells. *p < 0.05 by Student t test.
