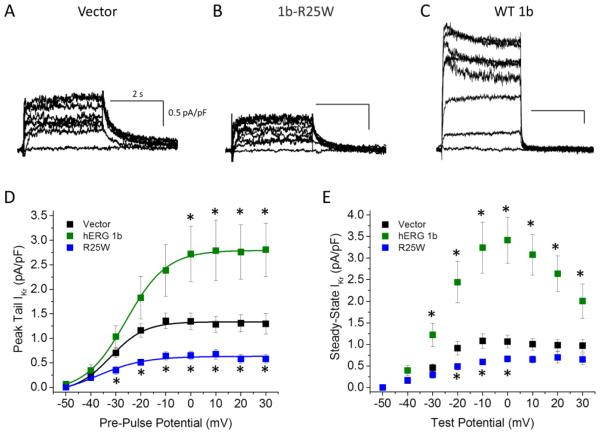
Figure 6.
1b-R25W displays a dominant negative phenotype on native IKr. Sample E-4031 sensitive current traces, indicative of IKr, recorded from induced pluripotent stem cell-derive cardiomyocytes (iPSC-CMs) transfected with pcDNA3.1 (Vector, A), WT hERG 1b (B), or 1b-R25W (C). (D) Peak tail IKr, measured at −40 mV, normalized to cellular capacitance, plotted as a function of pre-pulse potential, and fitted with a Boltzmann function for vector (black), WT hERG 1b (green), and 1b-R25W (blue) transfected iPSC-CMs. (E) Steady-state IKr, measured at the end of 3-second test pulse, normalized to cellular capacitance, and plotted as a function of test potential for vector (black), hERG 1b (green), and 1b-R25W (blue) transfected iPSC-CMs. * indicates statistical significance compared to Vector at p < 0.05. n = 6–11.

