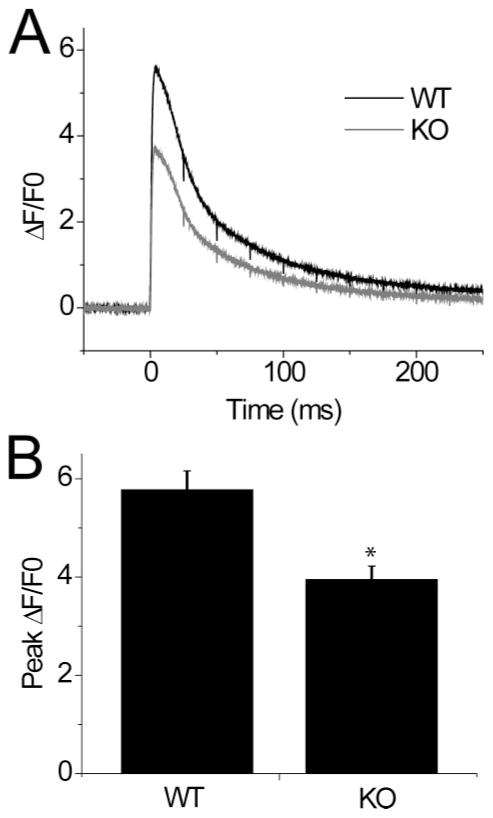
FIGURE 3. S100A1−/−muscle fibers exhibit decreased peak amplitude of the Fluo-4 Ca2+transient.
A, average transient responses to single AP stimulation from similar assay to Fig. 2A, performed with non-ratiometric Fluo-4 AM loaded fibers and assayed with high speed confocal line scan microscopy (50 μs/line) for increased temporal resolution. Data presented as ΔF/Fo. B, bar plot summarizing differences in peak amplitude of fluorescent transient. WT =5.78 ± 0.38, n =26; KO =3.95 ±0.27, n =25. *, data were significantly different at p = 0.0003.

