
Figure 1.
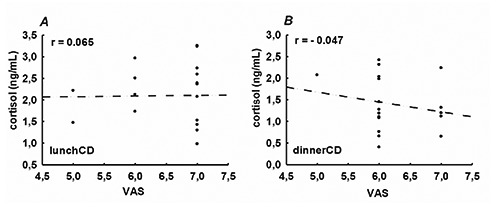
Spearman correlation between salivary cortisol and Visual Analogue Scale (VAS) after (A) lunchCD and after (B) dinnerCD; n=18 in each group. The r values for the linear correlation are in the top of the figure.
Official websites use .gov
A
.gov website belongs to an official
government organization in the United States.
Secure .gov websites use HTTPS
A lock (
) or https:// means you've safely
connected to the .gov website. Share sensitive
information only on official, secure websites.
Spearman correlation between salivary cortisol and Visual Analogue Scale (VAS) after (A) lunchCD and after (B) dinnerCD; n=18 in each group. The r values for the linear correlation are in the top of the figure.