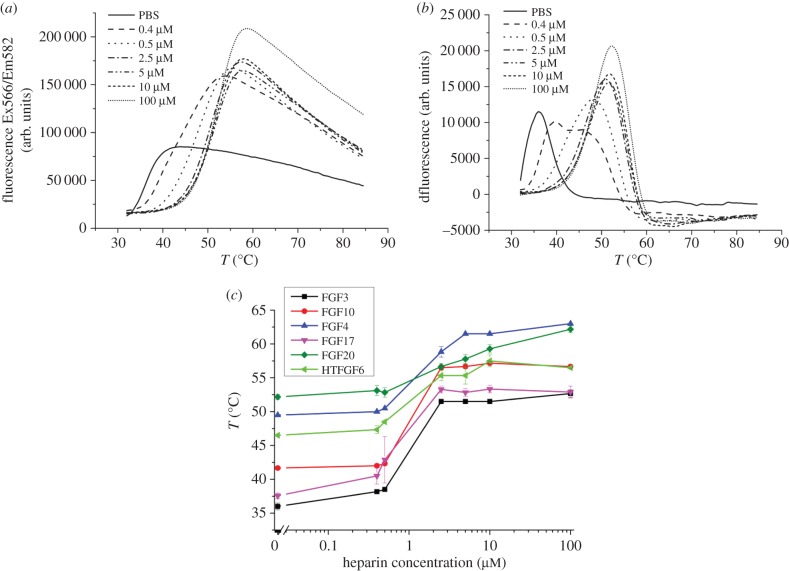
Figure 1.
Stabilization effect of heparin on FGF3. Differential scanning fluorimetry of 5 µM FGF3 in the presence of varying concentrations of heparin. (a) Melting curve profiles of FGF3 (5 µM) with a range of heparin concentrations (0–100 µM). (b) First derivative of the melting curves of FGF3 in (a). (c) Heparin-dependence of the melting temperature (Tm) of FGF3, FGF10, FGF4, FGF17, FGF20 and HT-FGF6, Tm is the mean of triplicates ± s.e.

