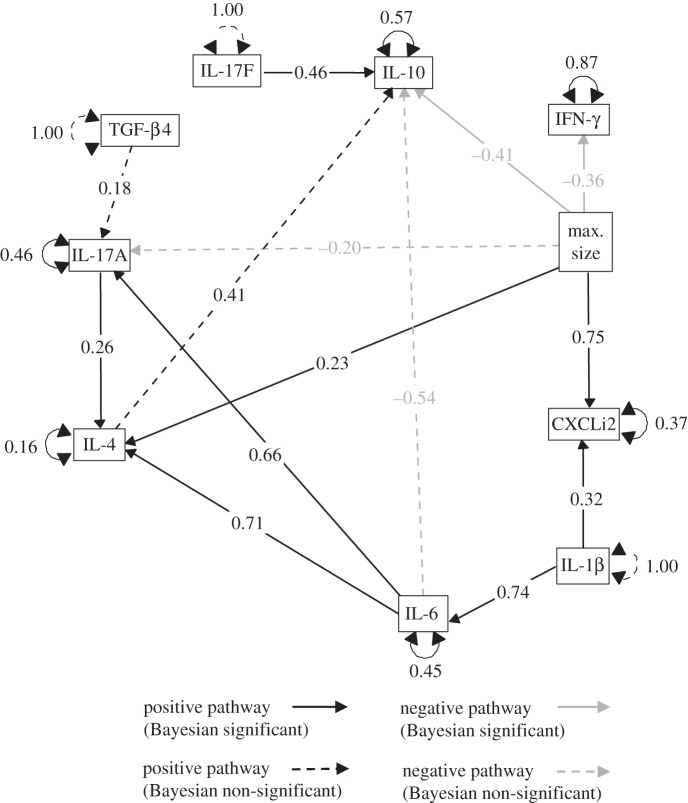
Figure 4.
The final path model describing the cytokine interactions post-challenge in two breeds of broiler chicken. Positive relationships are indicated by black arrows, whereas grey arrows indicate a negative response. The standardized parameter estimates for each response are shown on each arrow. The unexplained variation for each of the variables, internally predicated by the model, is shown adjacent to their respective boxes.

