
Figure 2.
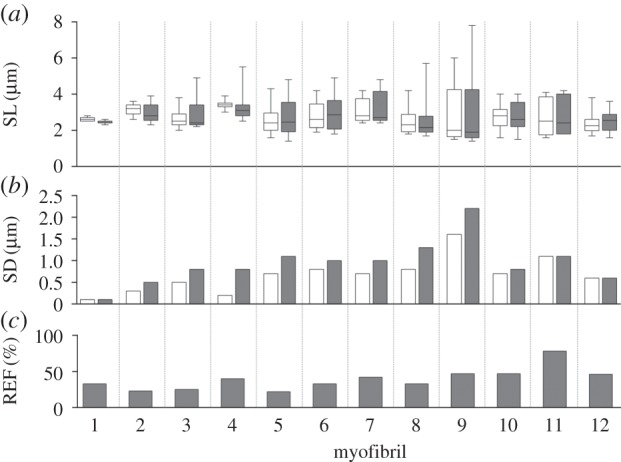
Results for each of the 12 myofibrils tested. (a) Tukey box plots of SLs for the I- (white) and FE- (shaded) states. (b) SD of the mean SL for the I- and FE-states. Note that a greater SD is indicative of a more non-uniform SL distribution. (c) Amount of RFE exhibited in each myofibril in the FE-state.