
Figure 3.
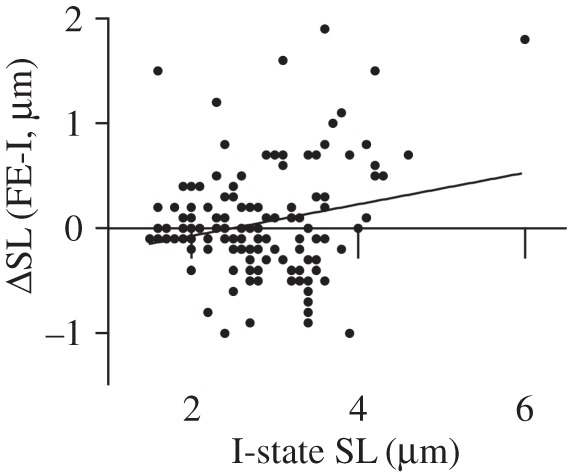
Change in individual SL from the I-state to the FE-state as a function of individual SL in the I-state for each of the 137 sarcomeres tested. The correlation between these variables was weak, but significant (r = 0.216; p = 0.011).
Official websites use .gov
A
.gov website belongs to an official
government organization in the United States.
Secure .gov websites use HTTPS
A lock (
) or https:// means you've safely
connected to the .gov website. Share sensitive
information only on official, secure websites.
Change in individual SL from the I-state to the FE-state as a function of individual SL in the I-state for each of the 137 sarcomeres tested. The correlation between these variables was weak, but significant (r = 0.216; p = 0.011).