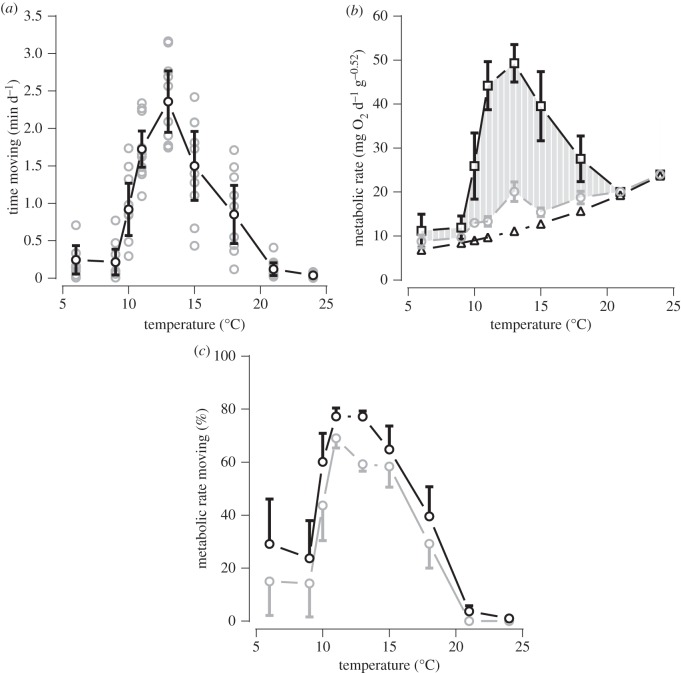
Figure 2.
King scallop (n=10–12 at each temperature) activity levels and estimates of metabolic rate against temperature. (a) Time scallops spent moving per day (each data point (grey circle) at each temperature represents a measured value from one individual); (b) routine metabolic rate (RMR; triangles), total metabolic rate (total MR; squares) and total MR excluding that associated with spinning and swimming (circles) per day—the grey-shaded area represents the magnitude of spinning and swimming activity metabolic rate (AMR); and (c) the percentage of total MR attributed to AMR (black) and to only spinning and swimming components of AMR (grey) against temperature. In each panel, means at each temperature are presented + and/or −95% confidence intervals (adapted for clarity).

