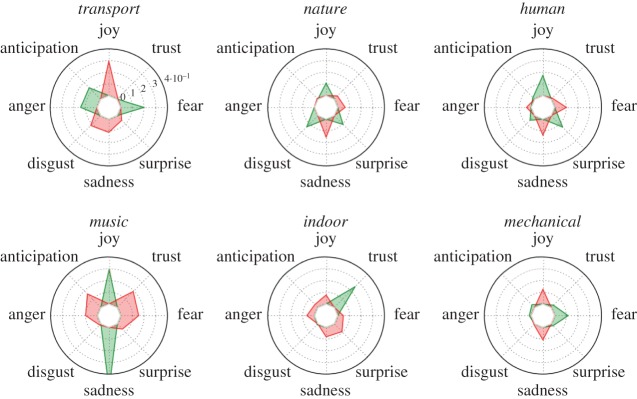
Figure 9.
Correlation between zsoundj,c and zemotionj,e. Each clock-like representation refers to a sound category. The different emotions unfold around the clock, and the emotions that are associated with the sound category are marked in green (positive correlations) or in red (negative emotions). All correlations are statistically significant at the level of p<0.01.

