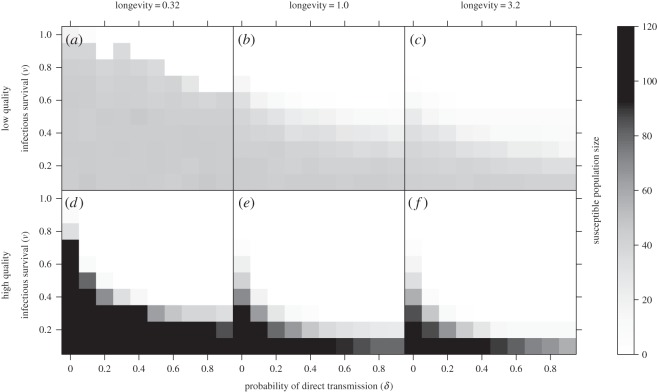
Figure 1.
Median total susceptible population size as a function of infectious survival (ν), and the probability of direct transmission (δ). Panel columns show low- (0.3, a,d), medium- (1.0, b,e) and high- (3.2, c,f) pathogen longevities, while rows show low-quality (ranging from 0.23 to 1.24, a–c) and high-quality (ranging from 0.76 to 1.77, d–f) patch quality distributions. Darker shading corresponds to larger population sizes, while white indicates that no susceptible host populations persist (i.e. all host populations become infected).

