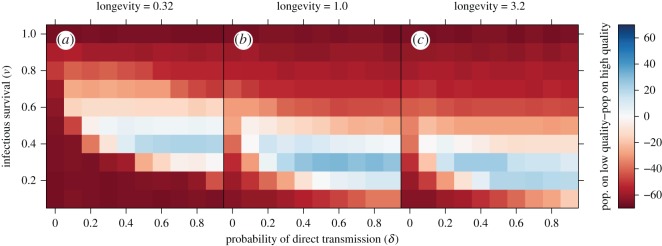
Figure 2.
Differences between the median total population size of hosts on low-quality patch distributions (quality between 0.23 and 1.24) and high-quality patch distributions (quality between 0.76 and 1.77) as a function of infectious survival (ν) and the probability of direct transmission (δ). Reds indicate that high-quality habitat distributions support higher median host population sizes than low-quality habitat, primarily corresponding to pathogens with either very limited or very extensive spread. Conversely, blues indicate higher median host population sizes on low-quality habitat distributions, corresponding to pathogens with intermediate levels of spread. Panel columns show low- (0.3, a), medium- (1.0, b) and high- (3.2, c) pathogen longevities.

