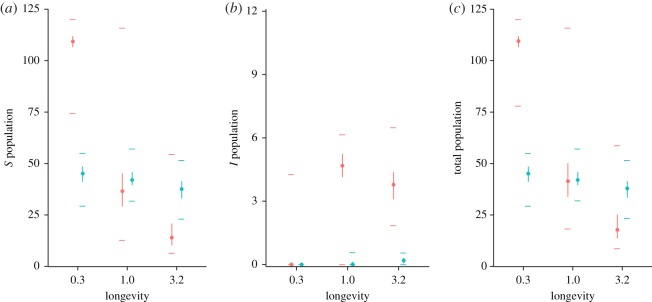
Figure 3.
Boxplots showing the range, over 100 replicate simulations, of susceptible (a), infectious (b) and total (c) host population sizes for high-quality (red) and low-quality (blue) habitat distributions. Infectious survival (ν) and direct transmission rate (δ) are fixed at values of 0.2 and 0.5, respectively. Coloured points show medians, while vertical lines indicate the inner-quartile ranges, with horizontal lines indicating the minimum and maximum. At low longevities, this pathogen is unable to invade and high-quality habitat supports larger populations of susceptible hosts. However, low-quality habitat is better able to maintain these susceptible hosts as the pathogen’s longevity increases, leading to larger total population sizes.

