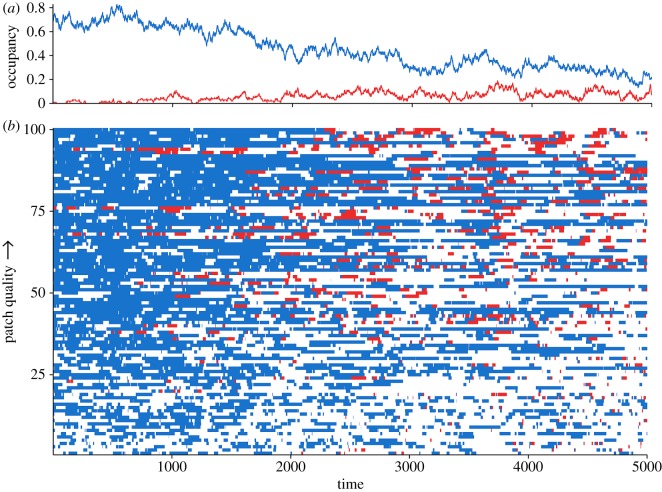
Figure 4.
Results from a single representative simulation with habitat quality uniformly distributed between 0.23 and 1.77, and a pathogen with an infectious survival of ν=0.2, a direct transmission rate of δ=0.5, and an environmental longevity of β=3.2. (a) shows total proportion of patches occupied by susceptible (blue) and infectious (red) hosts over time; (b) shows the state—susceptible (blue), infectious (red) or unoccupied (white)—of individual patches through time. Patches are stacked vertically with the lowest quality at the bottom and the highest quality at the top. Note the overall more consistent infectious occupancy on high-quality habitat and the only very brief spurts of infectious occupancy on low-quality habitat.

