
Figure 2.
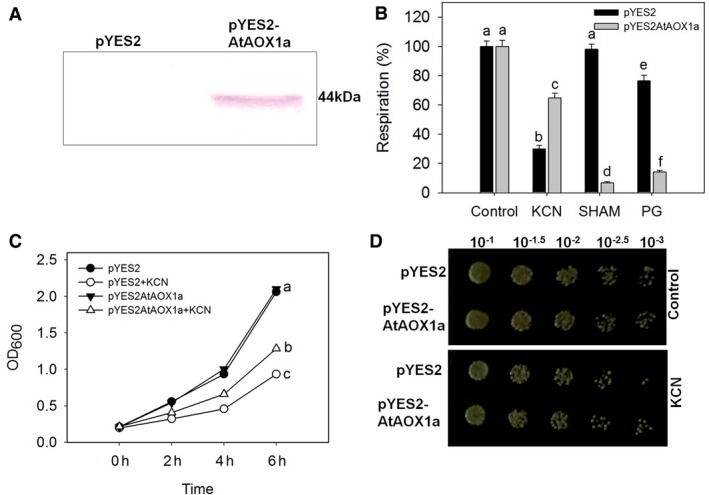
Functional expression of AtAOX1a in Saccharomyces cerevisiae. (A) Western blot showing the AtAOX1a protein (44 kDa) expression in pYES2AtAOX1a (right side) but not in PYES2 (left side); (B) Rates of oxygen uptake by pYES2 and pYES2AtAOX1a in the absence or presence of KCN (1 mm), SHAM (2 mm), and PG (100 μm); (C) Time‐dependent growth curve of pYES2 and pYES2AtAOX1a in the absence or presence of KCN (1 mm) and (D) Growth recovery in pYES2 and pYES2AtAOX1a after KCN (1 mm) treatment for 4 h. Different lowercase alphabetical letters indicate statistically significant difference (P < 0.05).