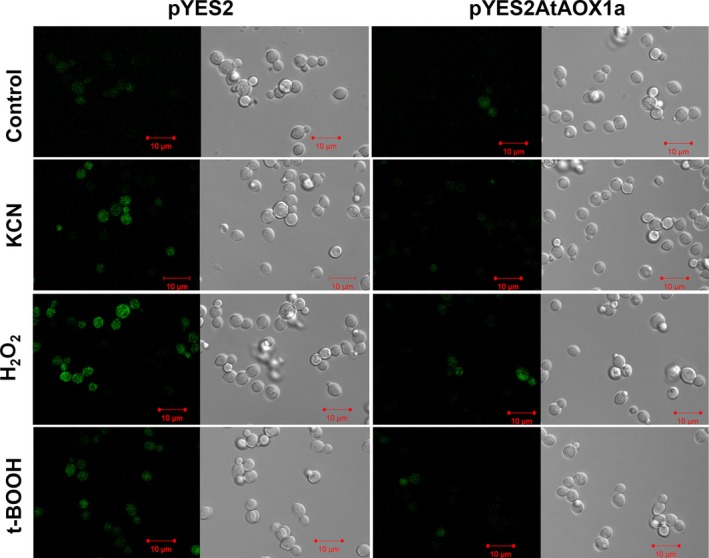
Figure 3.

Effect of H2O2 (2 mm) or t‐BOOH (0.25 mm) on the intracellular ROS generation. ROS were monitored in pYES2 and pYES2AtAOX1a at 488 nm (excitation) and 525 nm (emission) wavelengths under a confocal fluorescence microscope as DCF fluorescence produced by the action of esterases on H2 DCFDA. Sample treated with KCN (1 mm) was used as a positive control.
