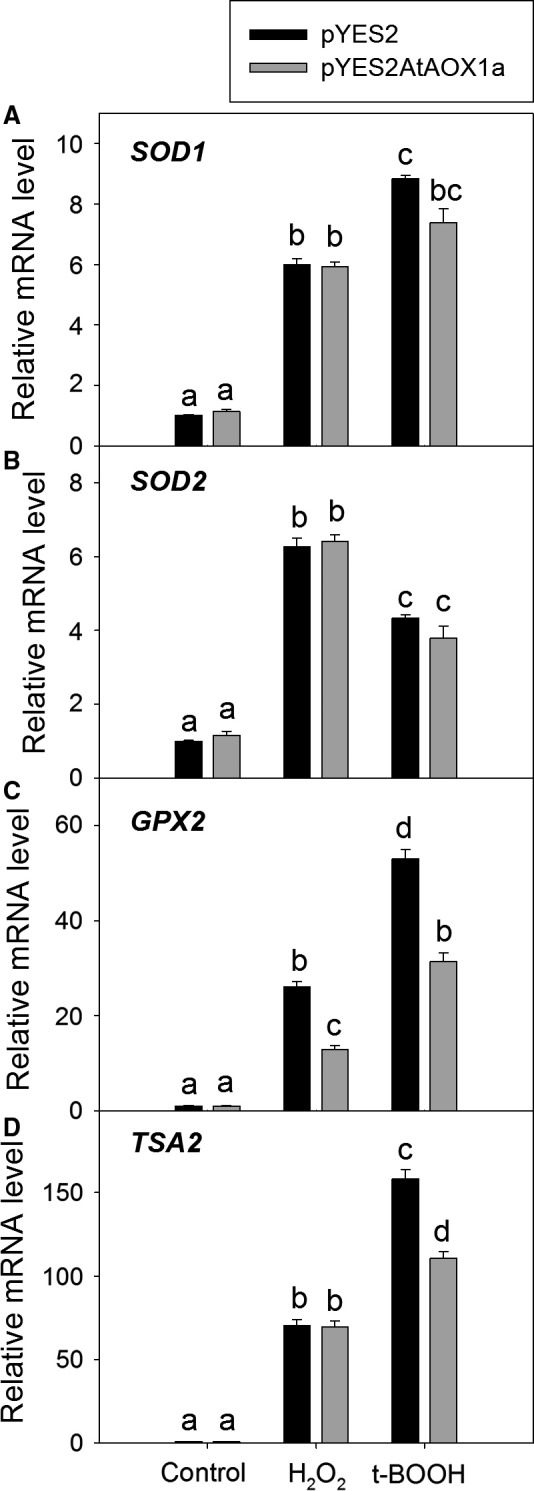
Figure 5.

Relative mRNA profile of the antioxidant genes (A) SOD1, (B) SOD2, (C) GPX2, and (D) TSA2 in pYES2 and pYES2AtAOX1a after exposure to H2O2 (2 mm) or t‐BOOH (0.25 mm). ACT1 was used as housekeeping gene. Different lowercase alphabetical letters indicate statistically significant difference (P < 0.05).
