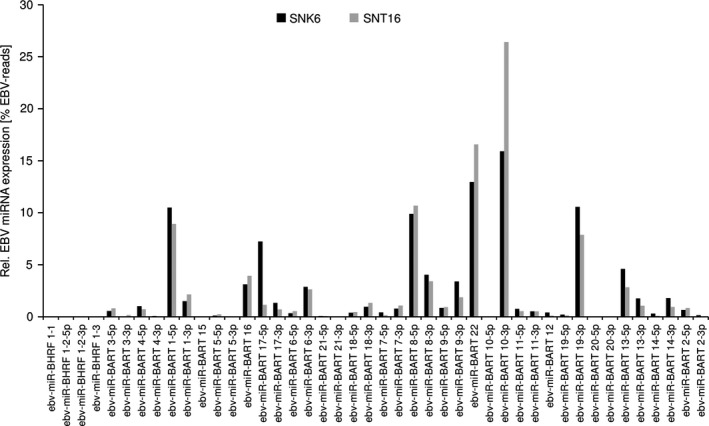
Figure 1.

Comparison of EBV‐miRNA expression levels in NKTL‐cell lines. ebv‐miRNA expression in the SNK6 vs. SNT16 cell lines. The relative levels of the ebv‐miRNAs obtained by sequencing of the two NK/T‐lymphoma cell lines were compared with each other. Black: SNK6, grey: SNT16.
