
Figure 3.
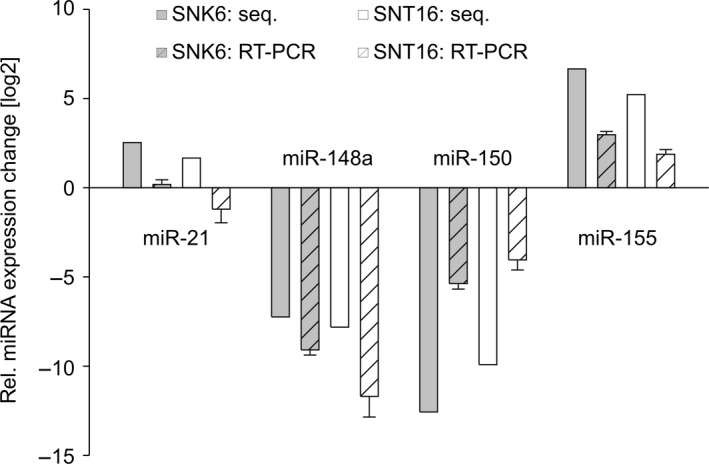
Validation of the Illumina results. The relative levels (SNK6 or SNT16/primary cells) of the four miRNAs hsa‐miR‐21 and hsa‐miR‐155 (determined as up‐regulated by sequencing) and hsa‐miR‐148a and hsa‐miR‐150 (determined as down‐regulated by sequencing), analysed by qRT‐PCR are shown. The graph represents the results of at least three independent experiments. Error bars show SD.