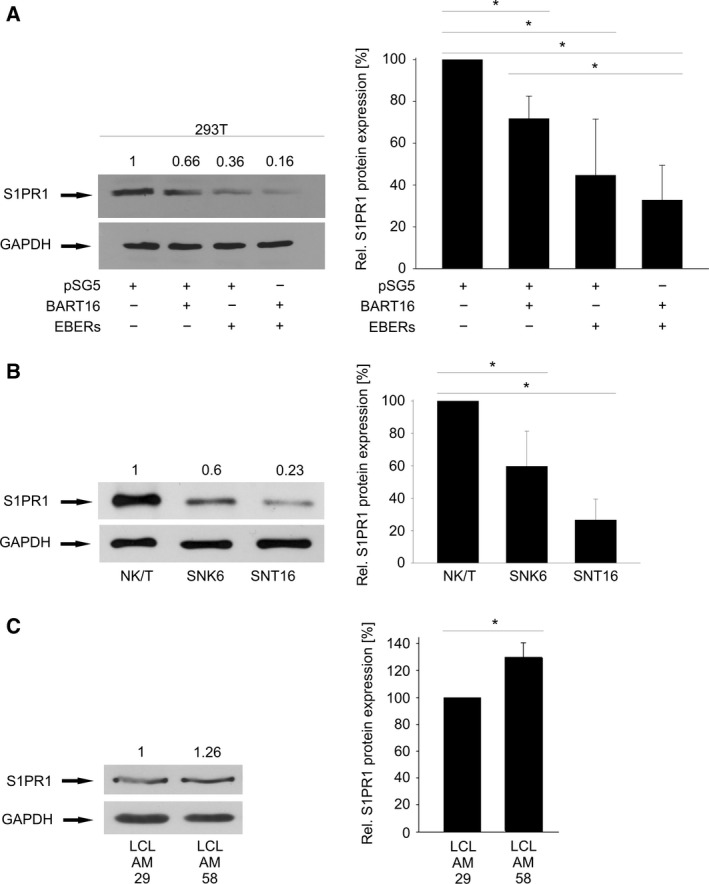
Figure 7.

Down‐regulation of S1PR1 protein by ebv‐miR‐BART16 and EBER. Western Blot analyses of S1PR1 levels in cell lines. (A) The empty pSG5 vector, pSG5‐BART16 and pSG5‐EBERs were transfected in HEK293T cells. The expression of BART16 and EBERs alone down‐regulated S1PR1 levels significantly (*P = 0.01, *P = 0.02 respectively). Co‐expression of BART16 and the EBERs further down‐regulated the S1PR1 protein level to a stronger extent than the BART16 plasmid alone (*P = 0.03) (B) S1PR1 is down‐regulated in NK/T‐cell lines (SNK6 and SNT16) compared to nontransformed CD56+/CD3+ primary cells (*P = 0.03, *P = 0.0006 respectively). (C) S1PR1 levels in lymphoblastoid cell lines established with an EBER‐deleted EBV (LCL AM 58) or with the parental EBV (LCL AM 29) (*P = 0.008). The quantification of at least three independent experiments is shown on the right side of a representative blot. Error bars show SD.
