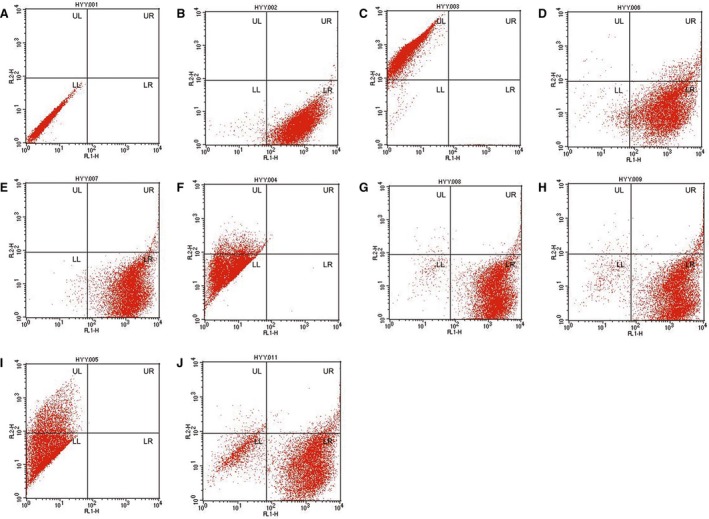
Figure 7.

The number of cells with EGFP and/or tdTomato fluorescent protein expression was evaluated by flow cytometry. (A) Control fibroblast cells. (B) EGFP‐expressing cells. (C) tdTomato‐expressing cells. (D) 2457. (E) 2459. (F) 2460. (G) Cells from a part of the tail of piglet 2461(Liter) with white skin color. (H) Cells from a part of the tail of piglet 2461 with black skin color. (I) 2462. (J) 2463 (Rature). (D–J) Cells were all isolated from the tail tissues of the newborn piglets. See also Table 6.
