Figure 4.

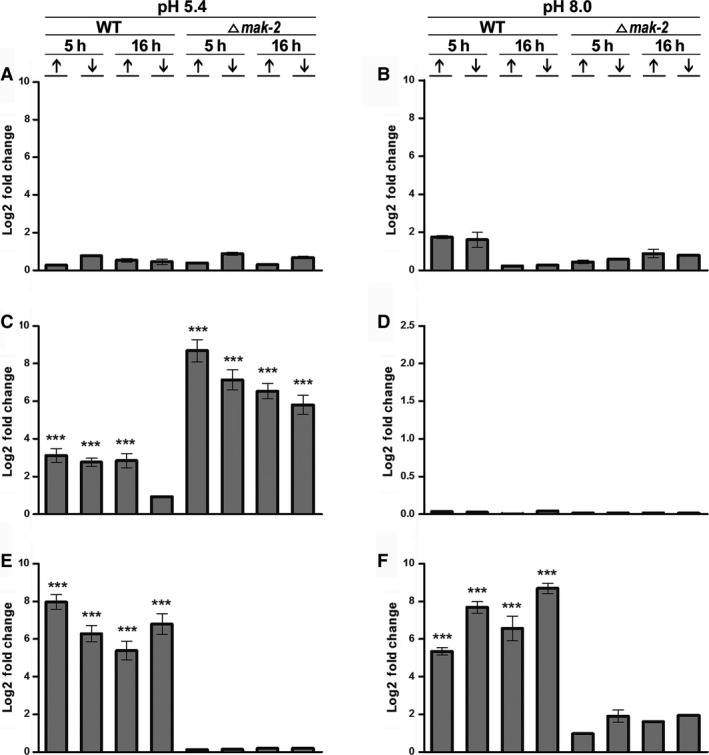
Real‐time PCR (qRT‐PCR) validation of intron‐3 transcript levels in the asn‐2 gene in N. crassa. Strains Δmak‐2 mutant and St.L.74A were incubated for 5 h and 16 h in high‐ (10 mm) (↑) or low‐Pi (100 μm) (↓), at pH 5.4 and pH 8.0, in the absence of antifungal (control) (A, B), with amphotericin B (C, D), and with ketoconazole (E, F). qRT‐PCR data are representative of the average values ± standard deviation (SD) obtained from three independent experiments. Statistically significant values are indicated by asterisks: Tukey's ad hoc test, ***P < 001.
