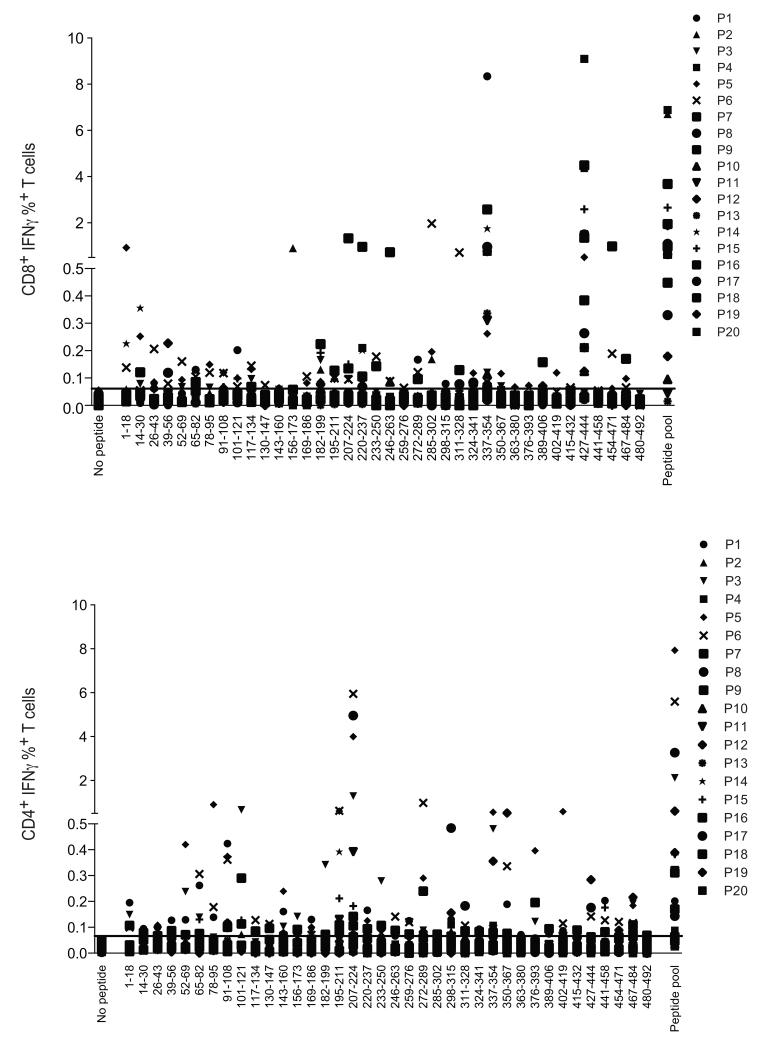
Figure 3. Immunodominance and epitope mapping of 21-OH specific T cell responses.
Percentage of 21-OH specific CD8+/CD3+ (top panel) and CD4+/CD3+ (bottom panel) T cells, as defined by IFN-γ intracellular staining. T cell responses were measured after in vitro T cell expansion with 21-OH overlapping peptides spanning the full-length 21-OH protein followed by stimulation with either individual peptides (amino acid sequence shown in the figure) or pool of all peptides (peptide pool). Negative control samples in DMSO (no peptide) are shown in each panel. Each symbol represents a different patient, corresponding to the order shown in Table 1. Horizontal straight line indicates the cut off value for positive responses, as defined by percentage values above the mean value of the percentage of IFN-γ secretion plus 3 times the standard deviation. Such values were 0.061% and 0.066% for CD8+ and CD4+ T cell responses, respectively.

