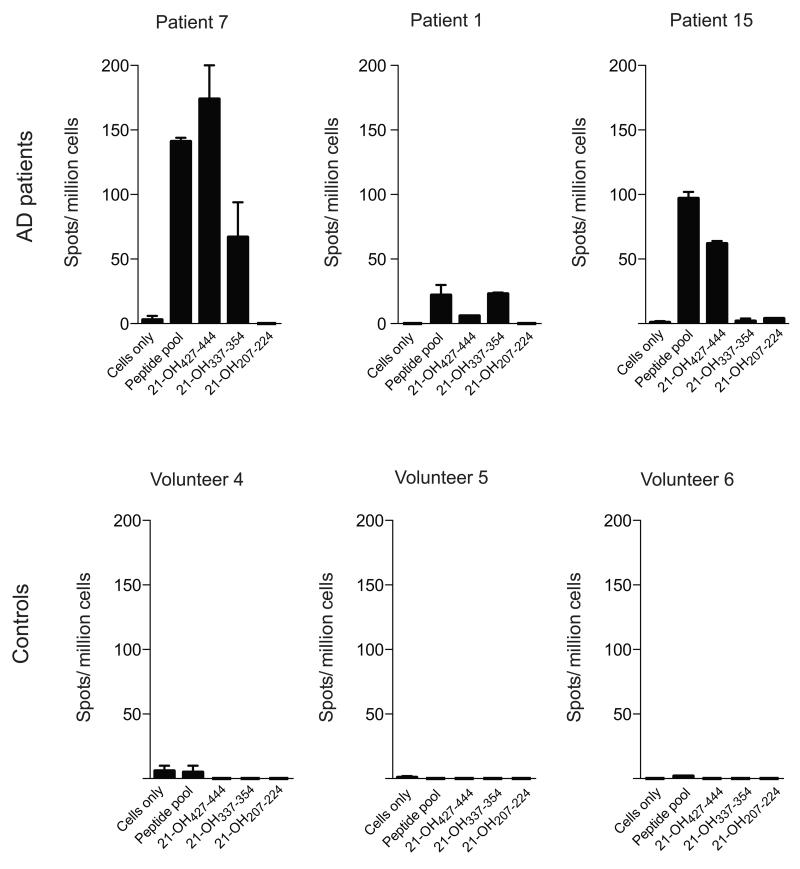
Figure 4. Addison’s Disease patients show strong ex-vivo T cell responses to 21-OH.
Ex-vivo ELISPOT assay with PBMCs from Addison’s disease patients (top panel) or healthy controls (lower panel) upon stimulation with pool of overlapping overlapping peptides spanning the full length 21-OH protein (peptide pool) or indicated peptides. Number of spots per million cells are shown on the Y axis. Results from 3 representative patients are shown. Bars represent Standard Error of the mean (SEM).

