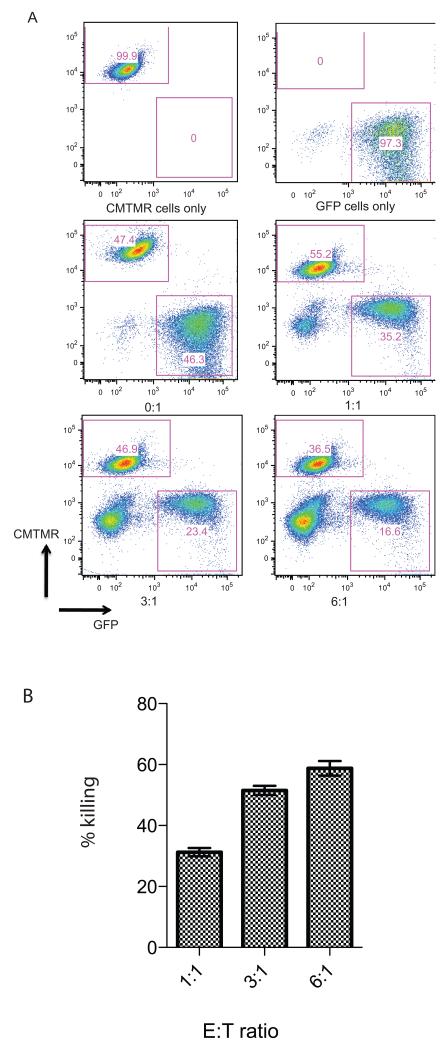
Figure 6. Ability of 21-OH specific T cells to lyse target cells expressing full-length 21-OH protein.
HLA-A2 restricted 21-OH342-350 specific T cell clone was co-incubated overnight at indicated E:T ratios with B cells either transduced with lentiviral vector encoding the full-length 21-OH protein and GFP or with CMTMR labeled untransduced B cells. Panel A shows FACS staining. Top two panels show target cells in the absence of the 21-OH342-350 specific T cell clone. Bottom four panels show co-cultures between T cell clone and target cells at the indicated E/T ratios. Increasing numbers of T cells are shown in the bottom left corner of each dot plot. The percentage of GFP+ and CMTMR+ labeled cells is shown in each dot plot. Panel B shows percentage of specific lysis of 21-OH positive target cells.

