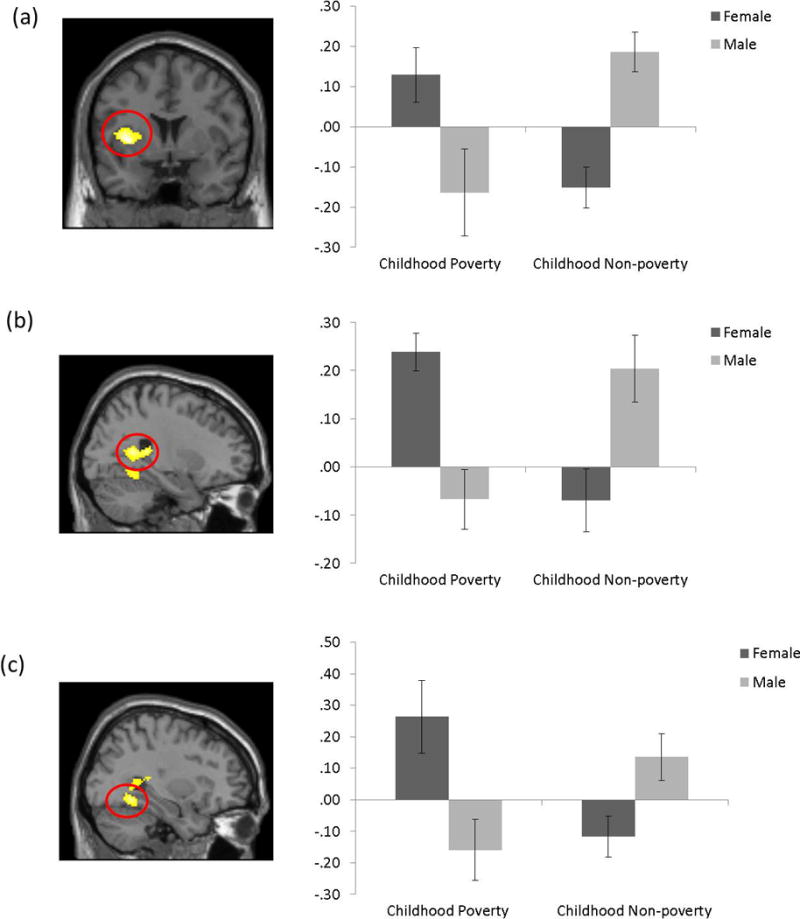
Figure 1.

Brain areas in a red circle showing Childhood Poverty-by-Gender on the Infant Cry vs White Noise contrast among males and females, p < .05, corrected. Color bars represent t values of the contrast. Percent signal change estimates for each contrast were averaged across the entire cluster for each participant. A. left posterior insula and striatum (BA13/44; x, y, z = −34, 4, 4); B. right calcarine sulcus, hippocampus, and precuneus (x, y, z = 26, −50, 12); C. right fusiform gyrus and parahippocampus (BA19/37; x, y, z = 32, −52, −10).
