
Figure 1.
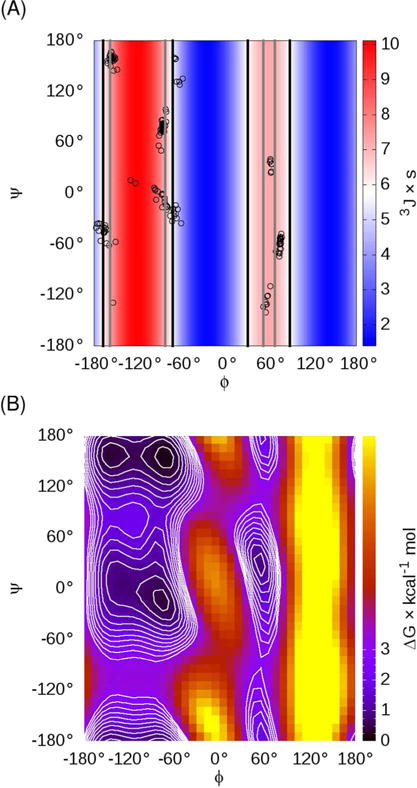
(A) Ramachandran plot with the structures in the ff99SB Ala3 training set3 shown as circles, with the Hu and Bax25 H-Hα Karplus curve data shown in the background as a color gradient. Vertical lines indicate the φ values where the Karplus curve matches the scalar coupling value from either NMR10 (black) or ff99SB simulations (gray). Note that ff99SB training data were limited near the maximum of the Karplus curve (φ=−120°), suggesting that the ff99SB energies may be poorly defined in this region. (B) Free energy surface for alanine dipeptide in ff99SB, showing that the β-ppII transition region near φ,ψ=−120°,160° has significant population despite lack of training data in Figure 1A.